Dashboarding and Visualization
All data has a story. Dashboarding and visualization tools enable you to tell this story in a clear and precise way. They give context to your data and quick insight into the state of your business.
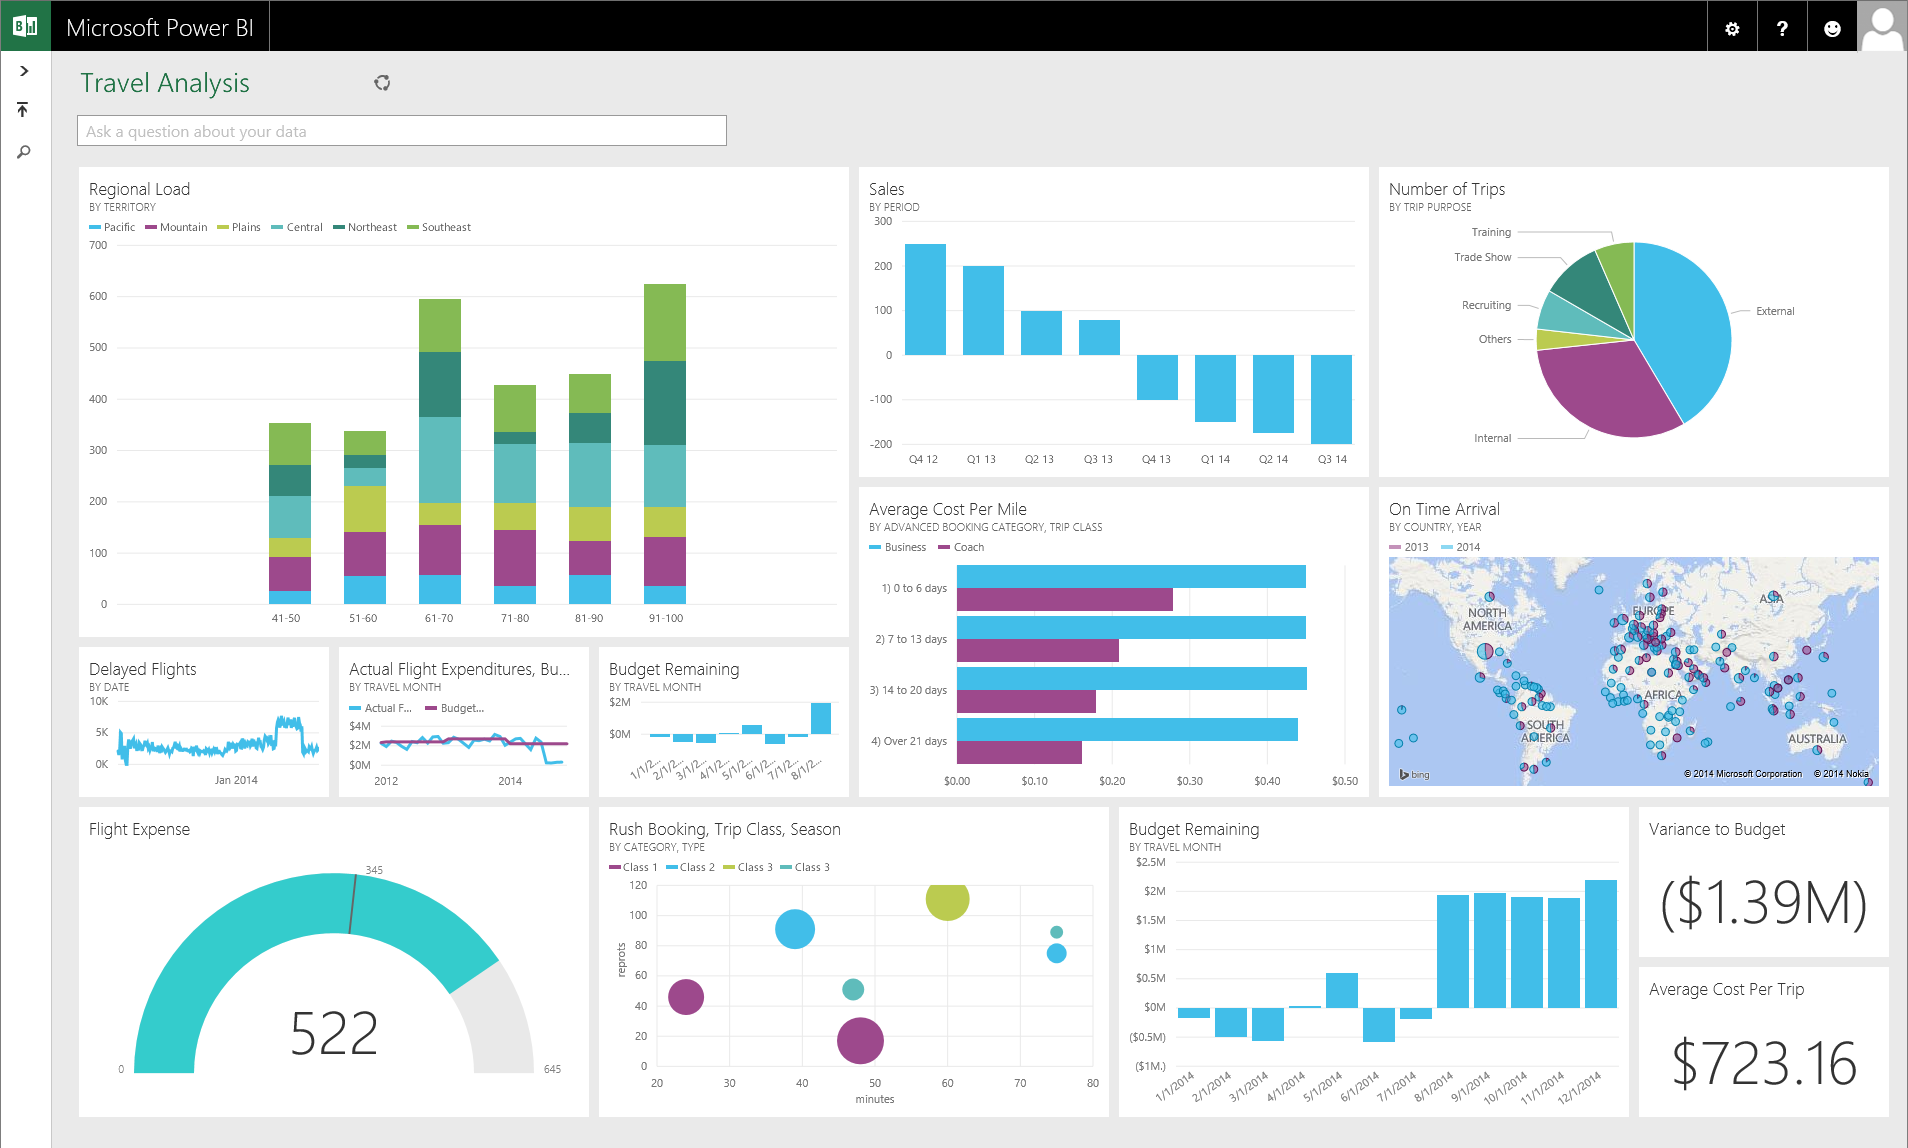
Our Data Analytics team can design and create dashboards and visualizations that will help you keep track of your most important KPIs. Tools, such as Microsoft’s Power BI, can very easily import your existing data and display it in a way that is simple to analyze, manipulate and adjust at a glance.
Optimus works with you to understand your business and the metrics that matter most to you. Our dashboards will break down your data into easily digestible morsels, allowing you to focus on the information that matters most.

