Using Azure Synapse to Simplify Reporting and Reduce Costs
When you’re a financial institution, you need to know where your money is and what it is doing. Financial Institutions are required to account for potential loan defaults and expenses to ensure they are presenting an accurate assessment of their overall financial health. This case study examines how Optimus used Azure Synapse to simplify the client’s monthly loan reporting processes and reduced their costs.
The Client
The client is an alternative specialty lender based out of Vancouver, Canada.
The Business Need
Our client was generating monthly reports to determine the loss of each of their loans (as required by the lenders who provide them with the funds to deploy). Previously, these reports involved tremendous manual processing. Several calculations had to be performed on the CSV files to determine any losses. In addition, new data had to be manually monitored in order to keep the calculations and reports accurate. All of this data was stored on a virtual machine and then transferred to Power BI to generate the required reports.
All of this manual processing resulted in expensive man-hours. So, the client was looking to automate their system to not only save time and money but also to create month-to-month reports they could easily draw strategic insights from the performance of each portfolio and if there are any red flags.
The Optimus Solution
Optimus provided a solution using a combination of Azure Synapse and Power BI. The solution involved three parts:
- Data ingestion from CSV and Excel files
- Data manipulation to get the loan loss
- Report generation to provide the information in an insightful and user-friendly interface
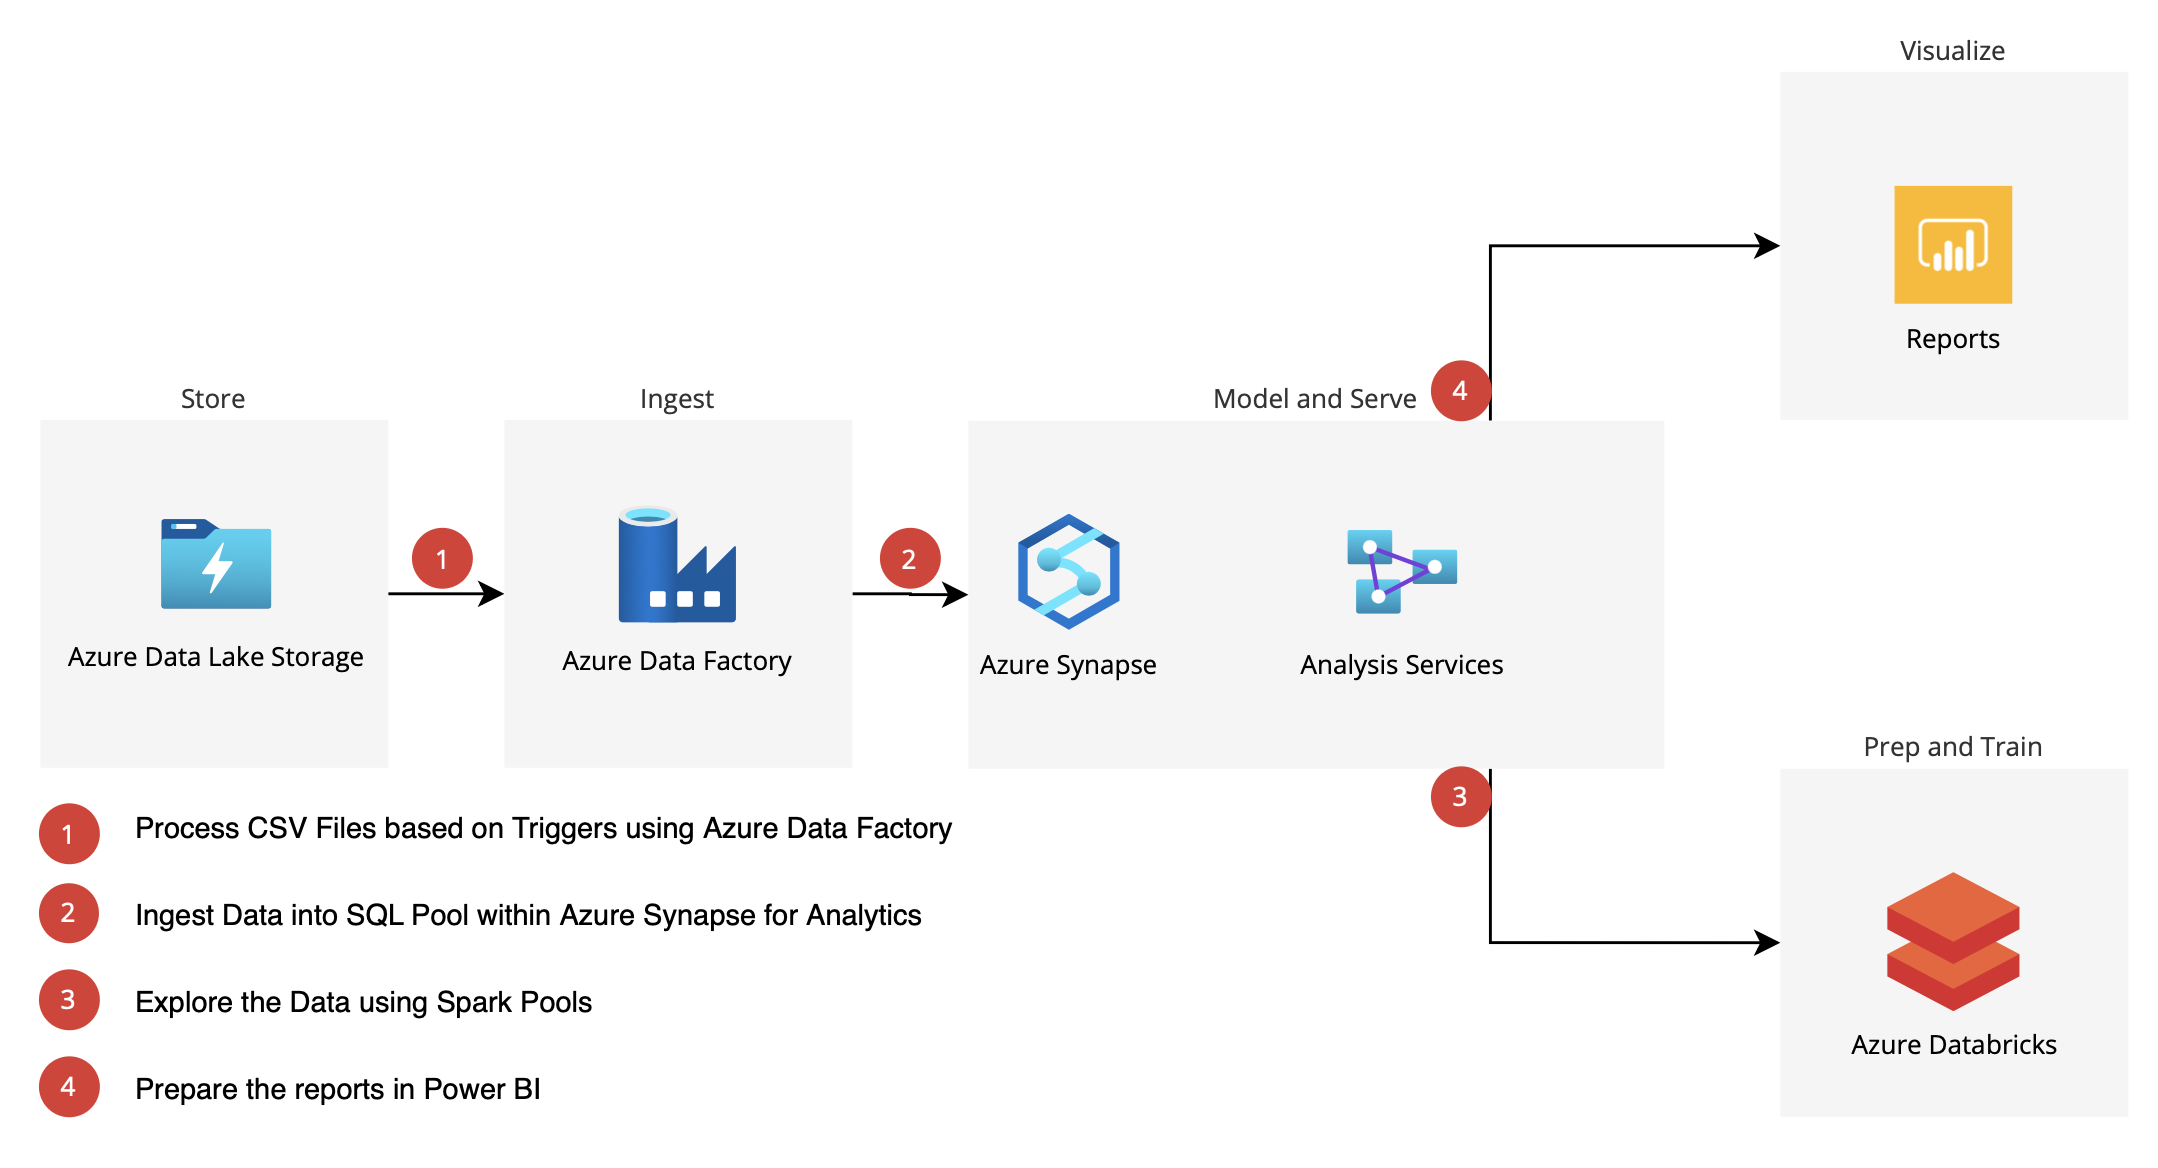
Optimus setup Azure Synapse Studio for the data ingestions, orchestration, and analysis. This included creating a pipeline that automates data manipulation. The automated process consists of the following steps:
- A monthly report file is added to an Azure Data Lake.
- This triggers the ingestion of the data into the designated SQL pool.
- This data is then stored in a Spark pool for exploration.
- The Spark pool data is then explored using Python running in Azure notebook.
- Data transformation and analytics is done using Azure Notebook
- Visualization and reporting is done on the same data using Power BI
The Result
The client now has an automated reporting system that eliminates manual monitoring. Using Azure Synapse we simplified their reporting process and reduced the costs. With the new loan loss report generated by Power BI, the client now has their data all in one user-friendly report instead of across different spreadsheets. This comprehensive report gives them the flexibility to filter the data, run ad hoc queries, and identify patterns more easily across different months to make strategic decisions.
Technologies Used
- Azure Synapse
- Spark Pool
- SQL On-Demand Pool (SQL Pool)
- Azure Data Lake (gen v2)
- Orchestration Tools
- Power BI
- Python – Pyspark, Pandas


